Extending Partial Lactation Records of Dairy cattle to 305 DIM in Tunisia
| [Volume 4, Article 1] | 129 kB |
B. Jemmali 1
A. Ben Gara 1*
B. Rekik 1
1ADIPARA LAB, Department of Science and Technology of Animal Productions, School of Higher Education in Agriculture of Mateur, University of Carthage, Tunisia
Summary - A set of 5831 records of Holstein-Friesian cows were used to test the accuracy of various linear regression models and the incomplete gamma function in projecting partial lactation records in Tunisian dairy herds. Prediction of milk yield produced in the 305 days minus actual days in milk (305–DIM) lactation period was carried out by different models: Three linear regression models and the incomplete gamma function for various intervals of days in milk (DIM), for both first and later parity cows, were used Coefficients of determination and prediction errors were used to test the goodness of fit of used models. A simple linear regression equation that accounts for daily yield during the actual DIM was found to be the most accurate among all models for estimating yield produced in the remaining of lactation. Prediction coefficients of the 305-Dim yield of the latter regression model varied from .79 to .83 and from .65 to .70 for primiparous and multiparous cows, respectively. These coefficients could be used to project incomplete lactations of dairy cows in Tunisia.
Keywords: Partial records / Dairy cattle / Prediction model / Projection.
-
Introduction
Culling and breeding decisions are often based on the standard 305 days production (305-d). A one test day yield is rarely used to eliminate cows for many reasons; in particular, low yield in a given test-day date might be a result of stress or accidents. Records in progress could however be used to predict a 305-d production. Several works (Norman et al., 1985; 1985; Bar-Anan et al., 1986; Gengler, 1995; Vargas et al., 2000) dealt with modelling full lactations and extending partial records. There are two major categories of models for prediction of yield during lactation, the linear regression models and the non linear models. Linear regression models were good predictors of production in the period following the peak of lactation, especially when the model included the last test-day record (Miller et al., 1972; Wiggans and Van Vleck, 1979; Bar-Anan et al., 1986). Models that were a good fit for lactation records needed an important number of parameters (Grossman et al., 1986; Vargas et al., 2000).
Projection of partial lactations is a common practice by many countries, especially those with functional genetic evaluations. Conditions (for example the minimum of days in milk for the record to be used in projection) for a short record to be projected do however vary from a country to another.
The objective of this study was to find a simple equation to predict a full lactation record from few test-day records for dairy cows in Tunisian herds.
-
Materials and methods
-
Data
-
A set of 5831 lactation records of Holstein-Friesian cows provided by the National Centre for Genetic Improvement (CNAG) at Sidi Thabet, Tunis, were used in the analysis. Data included the freshening date, parity, at least 10 consecutive test-day dates with corresponding yields, and the actual 305-d yield. Prediction of milk yield in the remaining lactation period (305-DIM) was studied for various intervals of DIM (Table 1). Each time a set of test-day records were generated from the complete set of records by deleting unnecessary records for a predefined DIM period.
-
Projection of partial records
Prediction of milk yield produced in the remaining 305-DIM lactation period was either carried out by linear regression models or was based on the incomplete gamma function (Wood, 1967). Linear regression models used were:
P(305-DIM) = (305-DIM) + e, (I)
P(305-DIM) = (PDIM/DIM) (305-DIM)+ e, (II) and
P(305-DIM) = 1 (305-DIM) + 2 (305-DIM)2 + e (III)
Where P (305-DIM) is milk yield produced in the 305-DIM lactation period; , 1, 2, and are regression coefficients; DIM is days in milk; PDIM represents actual production in DIM; and e are random errors. The estimated 305-d lactation yield was then calculated as:
P305 = PDIM + P(305–DIM) where P(305–DIM) was estimated by model I, model II, or mode III; or using the incomplete gamma function (model IV):
P305 = PDIM + 305DIM+1 a tb e–ct dt; or (IV)
where Yt is the observed milk yield at day t; a, b, and c are the curve parameters, a is linked to milk yield at the beginning of lactation, b to the ascending phase, and c to the decreasing phase; P305 is milk yield produced in the whole 305-d lactation period; PDIM and P(305–DIM): are as previously defined.
The a, b, and c parameters were found by fitting the incomplete gamma function (Wood, 1967). to test-day records across cows. Fitting was carried out by the Gauss-Newton algorithm in the NLIN procedure in SAS. Goodness of fit of prediction models for projecting partial production of first and later parity cows was studied by the coefficient of determination (1- the ratio of the residual sum of squares to the total sum of squares), the absolute value of the prediction error (actual yield – predicted yield), and the error variance.
|
Table 1. Intervals of days in milk, actual yield for the intervals of days in milk, and actual yield in the remaining 305-DIM period for primiparous and multiparous cows. |
||||
|
Parity |
Records |
DIM |
Actual yield |
Actual (305–DIM) Yield |
|
Primiparous
Multiparous |
1770 1885 1914 1905 1858
3569 3793 3823 3781 3721 |
100 100-150 150-200 200-250 250-290
100 100-150 150-200 200-250 250-290 |
2445 (589) 3221 (763) 4359 (1004) 5323 (1210) 6372 (1445)
2861 (708) 3727 (902) 4916 (1173) 5874 (1387) 6865 (1593) |
4365 (1064) 3584 (909) 2460 (687) 1497 (445) 447 (186)
4371 (1117) 3527 (952) 2339 (694) 1379 (435) 399 (182) |
|
(.) Standard deviation |
||||
-
Results and discussion
-
Milk yield
-
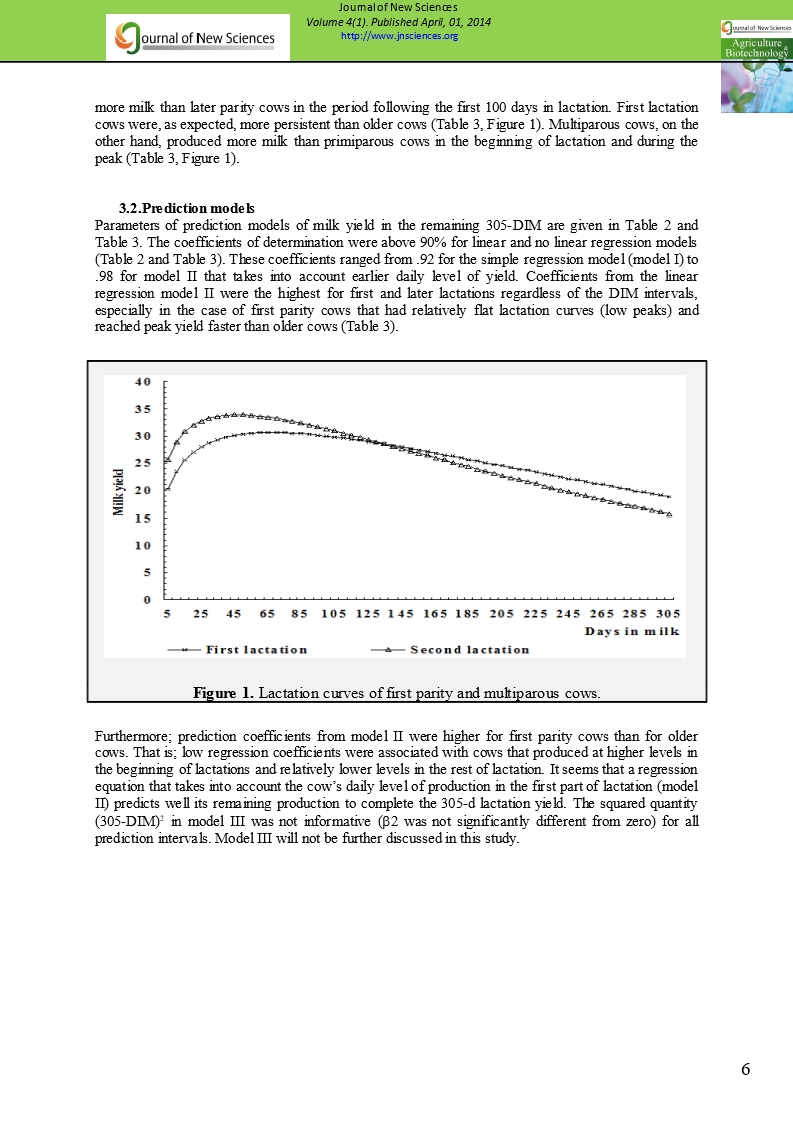
Actual milk yield during the various DIM and for the remaining 305-DIM period are presented in Table 1 for both first and later parity cows. These data showed that first parity cows produced slightly more milk than later parity cows in the period following the first 100 days in lactation. First lactation cows were, as expected, more persistent than older cows (Table 3, Figure 1). Multiparous cows, on the other hand, produced more milk than primiparous cows in the beginning of lactation and during the peak (Table 3, Figure 1).
-
Prediction models
Parameters of prediction models of milk yield in the remaining 305-DIM are given in Table 2 and Table 3. The coefficients of determination were above 90% for linear and no linear regression models (Table 2 and Table 3). These coefficients ranged from .92 for the simple regression model (model I) to .98 for model II that takes into account earlier daily level of yield. Coefficients from the linear regression model II were the highest for first and later lactations regardless of the DIM intervals, especially in the case of first parity cows that had relatively flat lactation curves (low peaks) and reached peak yield faster than older cows (Table 3).
|
|
|
Figure 1. Lactation curves of first parity and multiparous cows. |

Furthermore; prediction coefficients from model II were higher for first parity cows than for older cows. That is; low regression coefficients were associated with cows that produced at higher levels in the beginning of lactations and relatively lower levels in the rest of lactation. It seems that a regression equation that takes into account the cow’s daily level of production in the first part of lactation (model II) predicts well its remaining production to complete the 305-d lactation yield. The squared quantity (305-DIM)2 in model III was not informative (2 was not significantly different from zero) for all prediction intervals. Model III will not be further discussed in this study.
Table 2. Parameters of fitted regression models for primiparous and multiparous cows for various DIM intervals |
||||||||||
|
Model |
I |
II |
||||||||
|
Primiparous |
Multiparous |
Primiparous |
Multiparous |
|||||||
DIM |
β |
R2 |
β |
R2 |
|
R2 |
|
R2 |
||
|
100
100-150
150-200
200-250
250-290 |
21.0 (.12) 20.5 (.12) 19.9 (.12) 18.9 (.12) 18.2 (.13) |
0.92
0.93
0.94
0.94
0.94 |
21.0 (.09) 20.2 (.09) 19.1 (.09) 17.4 (.08) 16.4 (.09) |
0.92
0.93
0.93
0.94
0.94 |
0.83 (.003) 0.82 (.003) 0.81 (.003) 0.80 (.003) 0.79 (.004) |
0.97
0.97
0.97
0.98
0.97 |
0.70 (.002) 0.69 (.002) 0.69 (.002) 0.67 (.002) 0.65 (.003) |
0.94
0.96
0.97
0.97
0.97 |
||
|
(.): Standard error of estimate. |
||||||||||
|
Table 3. Parameters and mean absolute error (in Kg) of fitted curves by the incomplete gamma function for First parity and multiparous cows. |
|||||||||
|
Curve1 parameters |
Absolute error2 |
Peak |
|||||||
|
Parity |
a |
bx10-2 |
cx10-3 |
R2 |
Mean |
STD |
Kg |
Week |
P3 |
|
1 >=2 |
13.82 (0.36) 18.72 (0.30) |
24.67 (0.59) 20.88 (0.40) |
3.62 (0.06) 4.49 (0.04) |
0.95 0.94 |
1.95 2.95 |
1.78 2.61 |
26 31 |
10 6 |
7.15 6.59 |
|
( ): Asymptotic standard error. 1 Modeled as :Yt = a tb e–ct , where Yt = milk yield on day t, a= a factor to represent yield at the beginning of lactation, and b and c are factors associated with the ascending and decreasing phases of the lactation curve. 2Absolute error in kg: The error is the predicted test-day yield minus the actual yield of a cow in the same test-day. 3Persistency = -(b+1)*Ln (C) (Tekerli et al., 2000). |
|||||||||
-
Projection of partial records
For practical purposes, yield in the remaining 305– DIM period was estimated using numbers of test-days rather than intervals of DIM (Table 4). The average of days in milk was calculated for various numbers of test-days. These calculated averages were comparable in length to previously defined intervals of DIM (Table 2).
The mean of error absolute values for the various models (Table 4) was the lowest for model II. Models I and IV (In the case of model IV, Yield was estimated by the area under the incomplete gamma curve corresponding to the 305–DIM period) were the least accurate in predicting milk yield. They had the greatest mean absolute errors (Table 4).
Prediction of yield in the remaining 305-DIM period seems to become more accurate as cows advance in lactation. Both mean of error absolute values and its standard deviation decreased consistently with the increase in the number of test-day yields. Furthermore, models’ coefficients of determination increased with the actual number of days in milk for first and later parity cows (Table 2). That is, all models were sensitive to the increased information from the cow’s lactation history.
Pearson correlation coefficients of 305-d yield predicted by the various models with actual yield for the same period were high for all prediction models (Table 5). There were no clear differences, with respect to these coefficients, among the different models as was the case of the prediction error. Correlation coefficients were slightly higher for yield estimated by model II, especially when actual milking time was short (short DIM intervals).
Table 4. Mean absolute error (in Kg) associated with prediction models for various days in milk (DIM). |
||||
Prediction model |
||||
Number of test-days |
Average DIM |
I |
II |
IV |
3
5
6
7
8 |
101
164
196
227
259 |
884 (612)
605 (416)
474 (328)
332 (235)
201 (152) |
597 (472)
394 (306)
310 (242)
223 (175)
139 (119) |
882 (610)
606 (419)
469 (327)
332 (236)
200 (151) |
|
(.): Standard deviation |
||||
Table 5. Pearson correlation coefficients between actual 305-d yield and projected 305-d yield for various DIM intervals. |
||||
Prediction model |
||||
Number of test-days |
Average DIM |
I |
II |
IV |
3
5
6
7
8 |
101
164
196
227
259 |
.89
.95
.97
.98
.99 |
.90
.95
.97
.99
.99 |
.88
.95
.97
.98
.99 |
4. Conclusion
Projected lactation records can be used in making breeding decisions (culling) and in genetic evaluation. A simple and practical equation for predicting milk yield produced in The 305-DIM period from a cow’s producing history (the beginning of a 305-d lactation) was developed. A simple linear regression model that accounts for daily production level was sufficiently accurate in predicting milk yield for various DIM intervals. Coefficients of prediction were determined for various intervals of days in milk. These coefficients might be used to project part-lactation records in Tunisia.
Authors are thankful to the National Centre for Genetic Improvement at Sidi Thabet for providing the data.
5. References
Bar-Anan R. Weller J.I. Wiggans G.R. and Osterkorn, K. (1986) Prediction of annualised lactation yield from partial lactations. J. Dairy Sci. 69, 1897-1903.
Gengler N. (1995) Use of mixed models to appreciate the persistency of yields during the lactation of milk cows. Ph.D. Thesis. Faculté des Sciences Agronomiques de Gembloux, Belgique .
Grossman M. Kuck A. L. and Norton H.W. (1986) Lactation curves of pure-bred and crossbred dairy cattle. J. Dairy Sci. 69, 195-203.
Miller R.H. Pearson R. E. Fohrman M.H. and Creegan M. E. (1972) Methods of projecting complete lactation production from part-lactation yields J. Dairy Sci. 55, 1602.
Norman H.D. Dickinson F.N. and Wright J. R. (1985) Merit of extending completed records of less than 305 days. J. Dairy Sci. 68, 2646-2654.
SAS (1989) User’s Guide, Version 6.10 for windows.. SAS Inst. Inc., Cary, NC.
Tekerli M. Akinci Z. Dogan I. and Ackan A. (2000) Factors affecting the shape of lactation curves of Holstein cows from the Balikesir Province of Turkey. J. Dairy Sci. 83, 1381-1386.
Vargas B. Koops W. J. Herrero M. and Van Arendonk J.A.M. (2000) Modelling extended lactations of dairy cows. J. Dairy Sci. 83, 1371-1380.
Wiggans G.R. and Van Vleck L.D. (1979) Extending partial lactation milk and fat records with a function of last sample production. J. Dairy Sci. 62, 316.
Wood P. D. P. (1967) Algebraic model of the lactation curve in cattle. Nature, Lond. 216, 164-165.