Regional and phenological effects of Tunisian Safflower (Carthamus tinctorius) essential oil leaves
| [Volume 9, Article 1] | 311 kB |
N. SALEM
K. MSAADA
M. HAMMAMI
S. SELMI
F. LIMAM
B. MARZOUK
Laboratory of Bioactive Substances, Biotechnology Center in Borj-Cedria Technopol, Hammam-Lif, Tunisia
Abstract - In order to recovery and valorize vegetable resources in Tunisia, this work was carried out to evaluate the composition of leaves essential oil at two different Tunisian regions (Beja and Tunis) and during flower development of safflower. A total of 20 compounds were identified representing 97% of the total constituents of essential oil leaves. Two main chemotypes were identified as methyl eugenol and caryophyllene oxide and characterized this composition of essential oil. The maximums of the two volatile compounds were detected at fructification stage with 22,45% for caryophyllene oxide, followed by methyl eugenol with 18,51% in the region of Beja. Oxygenated sesquiterpenes were the predominant class of leaves essential oil during flowering stages with percentages ranging from 20,13 to 24,3% (Beja) and from 19,19 to 22,45% (Tunis).
Keywords: safflower / fructification / chemotypes / essential oil.
1. Introduction
Nowadays, essential oils have a considerable interest in folk medicine, food flavoring, fragrance and pharmaceutical industries (Alma et al. 2007). Essential oils are complex mixtures, constituted by terpenoid hydrocarbons, oxygenated terpenes and sesquiterpenes. They are responsible for their characteristic aroma. In the frame of essential oil contribution to the industry resides, much interest were attributed to the characterization of its composition. However, the quality and quantity of these natural substances is often fluctuating depending on environmental conditions and the state of plant development (Salem et al. 2013).
Safflower (Carthamus tinctorius. L), a member of Asteraceae family, is one of the important aromatic and medicinal plants. It is a branching, thistle-like herbaceous annual plant with numerous spines on leaves and bracts. Safflower is a multipurpose crop exclusively used in treatment of cardiovascular, cerebro-vascular and gynecological diseases (Salem et al. 2011). Despite the wealth of studies focusing on lipids and dyes in safflower, there is unavailable data on regional and phonological effects on essential oil composition of safflower leaves. Therefore, the aim of this study was to characterize C. tinctorius leaves essential oil and yield at different stages of flower development and at two different Tunisian regions (Beja and Tunis) in order to determine the optimal period of essential oil production and to valorize C. tinctorius as natural Tunisian crop.
2. Material and methods
2.1. Plant material
C. tinctorius (Figure 1) leaves were harvested randomly by hand ![]() (three times) from plants growing wild in Tunis (North Eastern Tunisia; latitude 36° 49’ 7.72’’(N); longitude 10° 09’ 57.46’’(E), altitude 111.37 m) and Beja (North Western Tunisia; latitude 36° 43’31.19’’(N); 9° 11’ 14.52’’(E), altitude 225 m) and at different stages of flower development. The harvested plants were identified by Professor. A. Smaoui (Biotechnology Center in Borj-Cedria Technopole, Tunisia) according to the Tunisian flora (Alapetite 1979) and a voucher specimen was deposited at the herbarium of the Laboratory of Bioactive Substances, Biotechnology Center in Borj-Cedria Technopole. After that, the samples were freeze-dried and then ground to fine powder by an electric mill and conserved in a dessicator at room temperature (~25 °C) in darkness for further uses.
(three times) from plants growing wild in Tunis (North Eastern Tunisia; latitude 36° 49’ 7.72’’(N); longitude 10° 09’ 57.46’’(E), altitude 111.37 m) and Beja (North Western Tunisia; latitude 36° 43’31.19’’(N); 9° 11’ 14.52’’(E), altitude 225 m) and at different stages of flower development. The harvested plants were identified by Professor. A. Smaoui (Biotechnology Center in Borj-Cedria Technopole, Tunisia) according to the Tunisian flora (Alapetite 1979) and a voucher specimen was deposited at the herbarium of the Laboratory of Bioactive Substances, Biotechnology Center in Borj-Cedria Technopole. After that, the samples were freeze-dried and then ground to fine powder by an electric mill and conserved in a dessicator at room temperature (~25 °C) in darkness for further uses.
|
|
|
Figure 1 : Carthamus tinctorius (A) : Carthamus tinctorius plant, B : yellow and red Carthamus tinctorius flowers). |
|


2.2. Essential oil extraction
Air-dried leaves (100 g, three times for each stage) were subjected to hydrodistillation for 90 min in accordance with European Pharmacopoeia method (Council of Europe 1997). This time was fixed after a kinetic survey during 30, 60, 90 and 120 min. The distillate (100 mL) was extracted with 100 mL of diethyl ether (Analytical Reagent, LabScan, Ltd., Dublin, Ireland) for 30 min (three times) and dried over anhydrous sodium sulphate. The organic layer was then concentrated at 27,9 °C using a Vigreux column at atmospheric pressure and the resulting essential oil was subsequently analysed. Essential oil extractions were done in triplicate for each collection site and stage. Yield percentage was calculated as volume (mL) of essential oil per 100 g of plant dry matter.
2.3. Gas chromatography (GC) analysis
Analysis of essential oil volatile compounds by gas chromatography (GC) was carried out on a Hewlett-Packard 6890 gas chromatograph (Palo Alto, CA, USA) equipped with a flame ionization detector (FID) and an electronic pressure control (EPC) injector. A polar polyethylene glycol (PEG) HP Innowax and a 5% diphenyl, 95% dimethylpolysiloxane apolar HP-5 capillary columns (30 m x 0,25 mm, 0,25 mm film thickness; Hewlett-Packard, CA, USA) were used. The flow of the carrier gas (N2) was 1.6 mL/min. The split ratio was 60:1. The analysis was performed using the following temperature program: oven temperature kept isothermally at 40 °C for 10 min, increased from 40 to 205 °C at the rate of 3 °C/min and kept isothermally at 205 °C for 10 min. Injector and detector temperatures were held, at 250 and 300 °C, respectively. The injected volume was 1 µL of dilued oil. The individual peaks were identified by retention times and retention indices (relative to C8-C20 n-alkanes), compared with those of known compounds. Percentage compositions of samples were calculated according to the area of the chromatographic peaks using the total ion current.
2.4. Gas chromatography-mass spectrometry (GC-MS) analysis
GC/MS analysis was performed on an Agilent GC system 7890A coupled with a mass spectrometer Agilent 5975C inert XL MSD with electron impact ionization (70 eV). An HP-5MS capillary column (30 m x 0,25 mm coated with 5% phenyl methyl silicone, 95% dimethylpolysiloxane, 0,25 µm film thickness) was used. Oven temperature was programmed at 40 °C for 1 min, then heated to 100 °C at a rate of 8 °C/min, and then kept constant at 100°C for 5 min. then heated to 200°C at a rate of 10 °C/min, and then kept constant at 200°C for 3 min finally it rised to 300°C at a rate of 12 °C/min, transfer line temperature was 250 °C. The carrier gas was He with a flow of 1 ml/min and a split ratio of 100/1. Scan time and mass range were 1 s and 50-550 m/z, respectively. The identification of volatile components was assigned by comparison of their retention indices (RI) relative to (C8-C20) n-alkanes with those of literature or with those of authentic compounds available in the authors’ laboratory. Further identification was made by matching their recorded mass spectra with those stored in the Wiley 09 NIST 2011 mass spectral library of the GC/MS data system.
2.5. Statistical analysis
All analyses were performed in triplicate and the results were expressed as means values ± standard deviations (SD). The data was subjected to statistical analysis by using statistical program package ‘‘Statistica v 5.1” software (Statsoft 1998). A principal component analysis (PCA) was performed in order to discriminate between different stages of maturity on the basis of their essential oils composition. The one-way analysis of variance (ANOVA) followed by Duncan multiple range test were employed and the differences between individual means were seemed to be significant at P < 0.05.
3. Results and discussion
3.1. Essential oil yield
The evolution of essential oil yield of safflower leaves showed an optimum of production during the fructification stage with 0,17% in Beja and 0,18% in Tunis (Figure 2). Obtained yields were high when compared to other Asteraceae species such as Leucanthemum vulgare (0,03%), Chamomilla suaveolens (0,12%) and Chamomilla recutita (0,15%) (Raal et al. 2011). This variability may include seasonal, maturity variation, geographical origin, genetic variation, part of plant used and storage (Saeb and Gholamrezaee 2012).
|
|
|
Figure 2: Changes in essential oil yield (%, w/w) during C. tinctorius during its flowering. Essential oil yields with different majuscule and minuscule subscript were significantly different at p<0.05 (Duncan test). DARE; days after rosetta emergence |

3.2. Regional effect on essential oil composition
The essential oil components were identified from the safflower leaves in two Tunisian regions; their retention indices and their percentage are listed in Table 1. All the constituents were arranged in order of their elution on the HP-5 column although the retention indices of compounds confirmed on HP-Innowax column have been also included. In total 20 components were identified and quantified reaching about 97% of the total essential oil components.
Beja
Leaf essential oil composition of safflower in Beja was characterized by caryophyllene oxide as a chemotype. At flowering stage, the percentage of this major compound was 20,25% of total essential oil. Other main representative compounds were detected such as methyl eugenol (16,79%), α-pinene (8,03%) and cinnamyl acetate (7,29%).
The high rate of eugenol was potentially useful in the pharmaceutical field because of its antibacterial, antifungal, anti-inflammatory and antioxidant properties and its insecticide effect. Eugenol was also used as a flavoring agent in traditional medicine (Bhuiyan et al. 2010). These results are different to those from Ziarati et al. (2012) who found that the major compounds of dried flowers of Carthamus tinctorius L. growing in Iran were 1-hydroxy-3-propyl-5-(4-methyl-penten)-2-methylbenzene (25.2%), 2,5,5 trimethyl-3-propyl,tetra hydro 1- naphtol (19.8%) and benzaldehyde (8.0%). This difference observed in the major component of safflower essential oils could be determined by genetic factors and environnemental conditions (Aidi Wannes et al. 2007).
Tunis
As Beja region, the same main compounds were also detected in Tunis region but with higher levels of methyl eugenol (16,58%). This confers to this essential oil a methyl eugenol chemotype. The percentages of α-pinene (9,54%) and linalool (9,22%) were higher in this region than in Beja (Table 1). Several studies indicated that the chemical composition of essential oils of the same species may differ with regions, due to environmental, biotic and abiotic factors, climatic conditions and high trophic levels (Li et al. 2010). Volatile compounds of leaves essential oil of safflower belong to 7 chemical classes where oxygenated monoterpenes were the predominant class with 20.23% (Table 1). Finally, these results can be very useful to guide us to develop and understand the ecological and genetic factors responsible for this disparity in essential oil composition between the two regions of Tunisia.
|
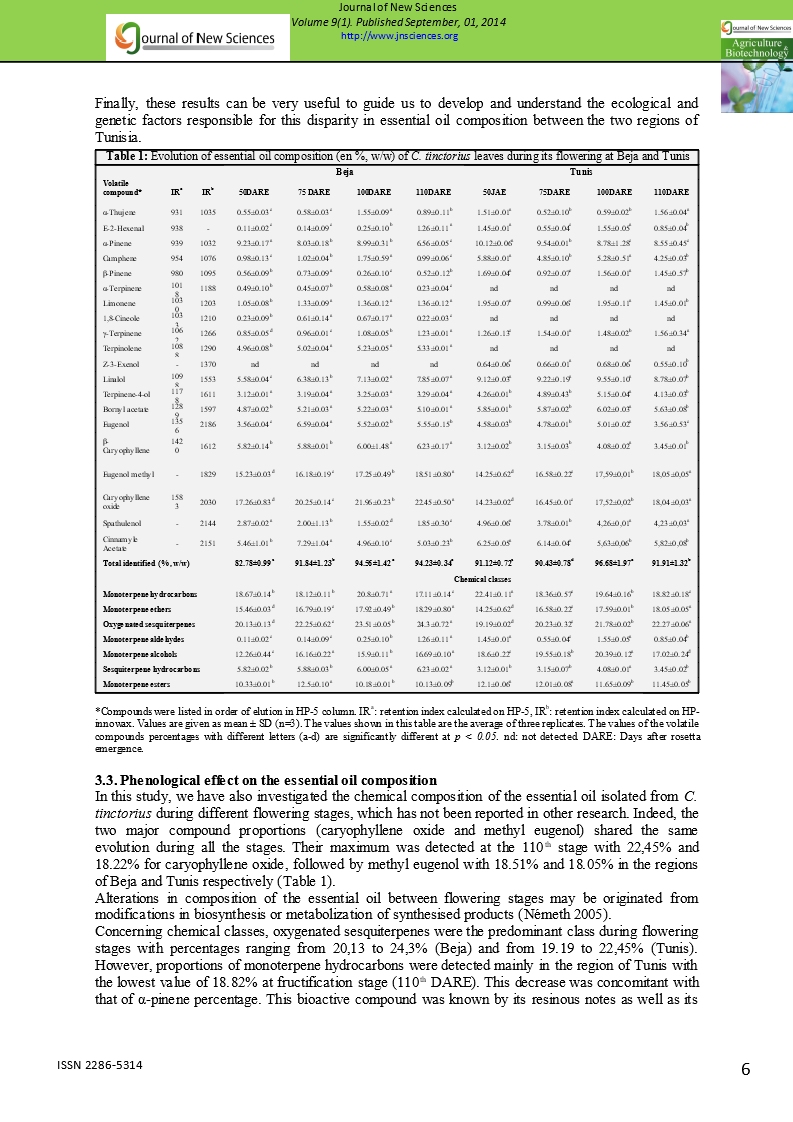
Table 1: Evolution of essential oil composition (en %, w/w) of C. tinctorius leaves during its flowering at Beja and Tunis regions.
|
||||||||||
|
|
Beja |
Tunis |
||||||||
|
Volatile compound* |
IRa |
IRb |
50DARE |
75 DARE |
100DARE |
110DARE |
50JAE |
75DARE |
100DARE |
110DARE |
|
α-Thujene |
931 |
1035 |
0.55±0.03c |
0.58±0.03c |
1.55±0.09a |
0.89±0.11b |
1.51±0.01a |
0.52±0.10b |
0.59±0.02b |
1.56±0.04a |
|
E-2-Hexenal |
938 |
- |
0.11±0.02c |
0.14±0.09c |
0.25±0.10b |
1.26±0.11a |
1.45±0.01a |
0.55±0.04c |
1.55±0.05a |
0.85±0.04b |
|
α-Pinene |
939 |
1032 |
9.23±0.17a |
8.03±0.18b |
8.99±0.31b |
6.56±0.05c |
10.12±0.06a |
9.54±0.01b |
8.78±1.28c |
8.55±0.45c |
|
Camphene |
954 |
1076 |
0.98±0.13c |
1.02±0.04b |
1.75±0.59a |
0.99±0.06c |
5.88±0.01a |
4.85±0.10b |
5.28±0.51a |
4.25±0.03b |
|
β-Pinene |
980 |
1095 |
0.56±0.09b |
0.73±0.09a |
0.26±0.10c |
0.52±0.12b |
1.69±0.04a |
0.92±0.07c |
1.56±0.01a |
1.45±0.57b |
|
α-Terpinene |
1018 |
1188 |
0.49±0.10b |
0.45±0.07b |
0.58±0.08a |
0.23±0.04c |
nd |
nd |
nd |
nd |
|
Limonene |
1030 |
1203 |
1.05±0.08b |
1.33±0.09a |
1.36±0.12a |
1.36±0.12a |
1.95±0.07a |
0.99±0.06c |
1.95±0.11a |
1.45±0.01b |
|
1,8-Cineole |
1033 |
1210 |
0.23±0.09b |
0.61±0.14a |
0.67±0.17a |
0.22±0.03c |
nd |
nd |
nd |
nd |
|
γ-Terpinene |
1062 |
1266 |
0.85±0.05d |
0.96±0.01c |
1.08±0.05b |
1.23±0.01a |
1.26±0.13c |
1.54±0.01a |
1.48±0.02b |
1.56±0.34a |
|
Terpinolene |
1088 |
1290 |
4.96±0.08b |
5.02±0.04a |
5.23±0.05a |
5.33±0.01a |
nd |
nd |
nd |
nd |
|
Z-3-Exenol |
- |
1370 |
nd |
nd |
nd |
nd |
0.64±0.06a |
0.66±0.01a |
0.68±0.06a |
0.55±0.10b |
|
Linalol |
1098 |
1553 |
5.58±0.04c |
6.38±0.13b |
7.13±0.02a |
7.85±0.07a |
9.12±0.03a |
9.22±0.19a |
9.55±0.10a |
8.78±0.07b |
|
Terpinene-4-ol |
1178 |
1611 |
3.12±0.01a |
3.19±0.04a |
3.25±0.03a |
3.29±0.04a |
4.26±0.01b |
4.89±0.43b |
5.15±0.04a |
4.13±0.03b |
|
Bornyl acetate |
1289 |
1597 |
4.87±0.02b |
5.21±0.03a |
5.22±0.03a |
5.10±0.01a |
5.85±0.01b |
5.87±0.02b |
6.02±0.03a |
5.63±0.08b |
|
Eugenol |
1356 |
2186 |
3.56±0.04c |
6.59±0.04a |
5.52±0.02b |
5.55±0.15b |
4.58±0.03b |
4.78±0.01b |
5.01±0.02a |
3.56±0.53c |
|
β-Caryophyllene |
1420 |
1612 |
5.82±0.14b |
5.88±0.01b |
6.00±1.48a |
6.23±0.17a |
3.12±0.02b |
3.15±0.03b |
4.08±0.02a |
3.45±0.01b |
|
Eugenol methyl |
- |
1829 |
15.23±0.03d |
16.18±0.19c |
17.25±0.49b |
18.51±0.80a |
14.25±0.62d |
16.58±0.22c |
17,59±0,01b |
18,05±0,05a |
|
Caryophyllene oxide |
1583 |
2030 |
17.26±0.83d |
20.25±0.14c |
21.96±0.23b |
22.45±0.50a |
14.23±0.02d |
16.45±0.01c |
17,52±0,02b |
18,04±0,03a |
|
Spathulenol |
- |
2144 |
2.87±0.02a |
2.00±1.13b |
1.55±0.02d |
1.85±0.30c |
4.96±0.06a |
3.78±0.01b |
4,26±0,01a |
4,23±0,03a |
|
Cinnamyle Acetate |
- |
2151 |
5.46±1.01b |
7.29±1.04a |
4.96±0.10c |
5.03±0.23b |
6.25±0.05a |
6.14±0.04a |
5,63±0,06b |
5,82±0,08b |
|
Total identified (%, w/w) |
82.78±0.99c |
91.84±1.23b |
94.56±1.42a |
94.23±0.34a |
91.12±0.72c |
90.43±0.78d |
96.68±1.97a |
91.91±1.32b |
||
|
Chemical classes |
||||||||||
|
Monoterpene hydrocarbons |
18.67±0.14b |
18.12±0.11b |
20.8±0.71a |
17.11±0.14c |
22.41±0.11a |
18.36±0.57c |
19.64±0.16b |
18.82±0.18c |
||
|
Monoterpene ethers |
15.46±0.03d |
16.79±0.19c |
17.92±0.49b |
18.29±0.80a |
14.25±0.62d |
16.58±0.22c |
17.59±0.01b |
18.05±0.05a |
||
|
Oxygenated sesquiterpenes |
20.13±0.13d |
22.25±0.62c |
23.51±0.05b |
24.3±0.72a |
19.19±0.02d |
20.23±0.32c |
21.78±0.02b |
22.27±0.06a |
||
|
Monoterpene aldehydes |
0.11±0.02c |
0.14±0.09c |
0.25±0.10b |
1.26±0.11a |
1.45±0.01a |
0.55±0.04c |
1.55±0.05a |
0.85±0.04b |
||
|
Monoterpene alcohols |
12.26±0.44c |
16.16±0.22a |
15.9±0.11b |
16.69±0.10a |
18.6±0.22c |
19.55±0.18b |
20.39±0.12a |
17.02±0.24d |
||
|
Sesquiterpene hydrocarbons |
5.82±0.02b |
5.88±0.03b |
6.00±0.05a |
6.23±0.02a |
3.12±0.01b |
3.15±0.07b |
4.08±0.01a |
3.45±0.02b |
||
|
Monoterpene esters |
10.33±0.01b |
12.5±0.10a |
10.18±0.01b |
10.13±0.09b |
12.1±0.06a |
12.01±0.08a |
11.65±0.09b |
11.45±0.05b |
||
*Compounds were listed in order of elution in HP-5 column. IRa: retention index calculated on HP-5, IRb: retention index calculated on HP-innowax. Values are given as mean ± SD (n=3). The values shown in this table are the average of three replicates. The values of the volatile compounds percentages with different letters (a-d) are significantly different at p < 0.05. nd: not detected. DARE: Days after rosetta emergence.
3.3. Phenological effect on the essential oil composition
In this study, we have also investigated the chemical composition of the essential oil isolated from C. tinctorius during different flowering stages, which has not been reported in other research. Indeed, the two major compound proportions (caryophyllene oxide and methyl eugenol) shared the same evolution during all the stages. Their maximum was detected at the 110th stage with 22,45% and 18.22% for caryophyllene oxide, followed by methyl eugenol with 18.51% and 18.05% in the regions of Beja and Tunis respectively (Table 1).
Alterations in composition of the essential oil between flowering stages may be originated from modifications in biosynthesis or metabolization of synthesised products (Németh 2005).
Concerning chemical classes, oxygenated sesquiterpenes were the predominant class during flowering stages with percentages ranging from 20,13 to 24,3% (Beja) and from 19.19 to 22,45% (Tunis). However, proportions of monoterpene hydrocarbons were detected mainly in the region of Tunis with the lowest value of 18.82% at fructification stage (110th DARE). This decrease was concomitant with that of α-pinene percentage. This bioactive compound was known by its resinous notes as well as its antifungal activity (Cakir et al. 2004), insecticides (Park et al. 2003) and antibacterial (Dorman et al. 2000).
Principal component analysis (PCA) was carried out in order to determine the relationship between the different stages of maturity on the basis of their essential oil composition. A better discrimination was revealed on the three-dimensional visualization of the plotted scores. Results obtained from the PCA showed the existence of three distinct groups; the first includes the stages of 100th DARE and 110th DARE, the second and third stages were formed by 50th DARE and 75th DARE which showed a different composition.
4. Conclusion
From the present study, it may be concluded that the best time to harvest the leaves of safflower for their essential oil is in the fructification stage.
Acknowledgments
The authors are grateful to Mr. Saber Khammassi (Borj-Cedria Technopol) for the optimization of essential oil extraction.
5. References
Alma MH, Ertaş M, Nitz S, Kollmannsberger H (2007) Chemical composition and content of essential oil from the bud of cultivated turkish clove (Syzygium aromaticum L.). Bioressources, 2: 265-269.
Salem N, Msaada K, Hammami M, Limam F, Vasapollo G, Marzouk B (2013) Variation in anthocyanin and essential oil composition and their antioxidant potentialities during flower development of Borage (Borago officinalis L.). Plant Biosyst, DOI:10.1080/11263504.2013.778349, 1-16.
Pottier-Alapetite G (1979) Flore de la Tunisie. Angiospermes-Dicotylédones Gamopétales. Imprimerie officielle de la république Tunisienne, Tunis, Tunisia. 1074.
Council of Europe 1997. European pharmacopoeia. 3rd ed., Strasbourg , France: Council of Europe.
Statsoft 1998 STATISTICA for Windows (Computer Program Electronic Manual). StatSoft Inc, Tulsa, OK.
Raal A, Kaur H, Orav A, Arak E, Kailas T, Müürisepp M (2011) Content and composition of essential oils in some Asteraceae species. Chemistry, 60: 55-63.
Saeb K, Ghlamrezaee S (2012) Variation of essential oil composition of Melissa officinalis leaves during different stages of plant growth. Asian J Trop Biomed, 2: s547-s549.
Bhuiyan MNI, Akter F, Chowdhury JU, Begum J (2010) Chemical constituents of essential oils from aerial parts of Adenosma capitatum and Limnophila aromatica. Bangladesh J Pharmacol, 5: 13-16.
Ziarati P, Asgarpanah J, Kianifard M (2012) The essential oil composition of Carthamus tinctorius L. flowers growing in Iran. Afri J Biotechnol, 11: 12921-12924.
Aidi Wannes W, Mhamdi B, Marzouk B (2007) Essential oil composition of two Myrtus communis L. varieties grown in North Tunisia. Ital. J. Biochem, 56: 180-186.
Li WQ, Jiang CH, Chu SS, Zuo MX, Liu ZL (2010) Chemical composition and toxicity against Sitophilus zeamais and Tribolium castaneum of the essential oil of Murraya exotica aerial parts. Molecules, 15: 5831-5839.
Nemeth E (2005) Essential Oil Composition of Species in the Genus Achillea. J Ess Oil Res, 17: 501-512.
Cakir A, Kordali S, Zengin H, Izumi S, Hirata T (2004) Composition and antifungal activity of essential oils isolated from Hypericum hyssopifolium and Hypericum heterophyllum. Flavour Frag J, 19: 62-8.
Park C, Kim SI, Ahn YJ (2003) Insecticidal activity of asarones identified in Acorus gramineus rhizome against three coleopteran stored-product insects. J Stored Prod Res, 39: 333-342.
Dorman HJD, Deans SG (2000) Antimicrobial agents from plants: Antibacterial activity of plant volatile oils. J. Appl. Microbiol, 88: 308-316.