Chemical composition, in vitro nitrogen-digestibility and gas production of sweet and bitter fenugreek seed genotypes
| [Volume 9, Article 4] | 182 kB |
H. Abdouli 1*
H. Missaoui 1
S. Jellali 1
L. Tayachi 1
S.K. Basu 2
1Laboratory of Improvement & Integrated Development of Animal Productivity & Food Resources, Higher School of Agriculture of Mateur, University of Carthage, Tunisia
2 Department of Biological Sciences, University of Lethbridge, AB Canada T1K 3M4
Abstract - Fenugreek, Trigonella foenum graecum, has been used for many purposes even though its bitter taste limits its acceptability. The objective of this study was to compare some nutritional aspects of a recently developed sweet genotype to the commonly and widely known bitter genotype. The two genotypes had almost identical proximate composition: crude proteins = 25.6 vs 25.7, ether extract = 4.8 vs 4.2 and total carbohydrate = 66.6 vs 66.7% dry matter for, the bitter and sweet genotypes, respectively. Their In vitro nitrogen digestibility coefficients were high (around 87%), not different (P>0.05) and not affected (P>0.05) by PEG addition. In vitro gas production parameters were not different (P>0.05) between the two genotypes yet sweet genotype tended to produce more gas (31 vs 27.5 ml/200 mg dry matter) with a faster and greater fermentation rate (3.87 vs 3.52 ml/h). calculated metabolizable energy (ME) and net energy for lactation (NEL) values based on in vitro gas production and chemical composition were slightly but significantly (P<0.0001) higher for the sweet fenugreek seed genotype: 6.21 vs 5.67 MJ ME/kg dry matter and 3.39 vs 2.99 MJ NEL/kg dry matter. It was concluded that both fenugreek seed genotypes can be used as valuable source of proteins feedstuffs in ruminant’s nutrition. In vivo comparison may be useful in further evaluation of the two genotypes.
Key words: Fenugreek seeds / chemical composition / digestibility / gas production
1. Introduction
Fenugreek, Trigonella foenum graecum, has been exploited as a medicinal agent and as a nutritional food. Such uses are due to fenugreek seed’s high proteins, soluble fiber and biologically active phytochemicals some of which are responsible for its characteristic smell, pungent aroma and bitter taste. The bitter taste limits fenugreek seed acceptability in foods (Sharma 1986; Udayasekhera and Sharma 1987) and various processing methods such as defatting and extracting with alcohol, soaking, germination, roasting (Sharma 1986; Shashi Kala 1997) have been used to debitter fenugreek seeds. However, such methods may cause losses in some nutrients. Recently, a claimed sweet fenugreek seed variety was developed in Tunisia. Its comparison with commonly cultivated bitter genotype revealed that the bitterness value was more than seven folds lower in the claimed sweet genotype but there were no differences in total phenols, total tannins, condensed tannins, total flavonoids and in vitro haemolytic and total antioxidant activities (Abdouli et al. 2014). The comparison was limited to some neutraceutical related aspects and the determination of some secondary metabolites using chemical methods employing standards the nature and biological activities of which could be different from the ones present in fenugreek seed. In view of this, the objective of this study was to extend the comparison of the two fenugreek seed genotypes to cover the nutritional aspect. In addition to gross chemical composition, In vitro nitrogen digestibility and gas production employing rumen inoculum were compared as these may best reflect the possible interaction of different bioactive compounds including the anti-nutritional factors in fenugreek seeds.
2. Materials and methods
2.1. Material
Two FS genotypes were used: the common known bitter genotype which is cultivated and used for human and animal feeding, and a new claimed sweet genotype registered in 2009 in Tunisian seeds catalogue as ‘RIHANNA’. Three separate samples from each genotype were milled to pass through a 0. 5 mm sieve and then crashed in a glass mortar to a fine powder. They were stored during the study in tight containers at room temperature.
2.2. Analyses
2.2.1. Chemical composition
Fenugreek seed dry matter was determined at 104°C for 24. Ash content was determined by igniting the ground sample at 550° C in a muffle furnace for 12 h. The Association of Official Analytical Chemists method (1984) was used for crude proteins determination and the Bradford (1976) assay was used for proteins determination with Coomassie Brilliant Blue G-250 as color reagent and bovine serum albumin (BSA) as standard. Acid detergent fiber (ADF) and neutral detergent fiber (NDF) were determined as described by Van Soest et al. (1991) but sodium sulphite and alpha amylase were omitted from the NDF procedure. Starch was determined by the method of Jarvis and Walker (1993). Total carbohydrates content was calculated by: 100- (% ash + % Ether extract + %crude proteins). Non-fibrous carbohydrate (NFC) was calculated using the equation of NRC (2001): NFC% = 100 – (%NDF + %CP + % EE + %Ash).
2.2.2. In vitro nitrogen digestibility
In vitro nitrogen digestibility (IVND) was measured by the first stage of Tilley and Terry (1963) method modified as follows. Quadruplet FS powder samples (0.5g) were put in Ankom filter bags which were sealed and incubated in individual tubes in the presence or absence of PEG. Rumen fluid from beef cattle from the municipal slaughterhouse was the inoculum source. The PEG was added into the tubes immediately before addition of the rumen fluid/buffer (1/4, v/v) to provide 80 mg PEG/tube or 160 mg/g sample. Samples were incubated at 39°C in a water bath. The bags were washed with distilled water after digestion, dried, weighed and analyzed for nitrogen. IVND were calculated from the initial and final weights of nitrogen after corrections using mean nitrogen content of 4 blank (no sample) bags.
2.2.3. In vitro gas production
Parameters of in vitro gas production were determined according to the Menke and Steingass method (1988) in 100 ml glass syringes. Rumen fluid was brought in a pre-warmed thermos flask from the slaughter house within 20 minutes before inoculation, filtered under CO2 through eight layers of cheese cloth and mixed with two volumes of McDougall‘s synthetic saliva warmed to 39°C. Using an automatic volume dispenser, 30 ml of the buffered rumen fluid solution was introduced under CO2 in each syringe containing 200 mg of ground sample. Syringes were shaken and placed in the incubator at 39 °C. Samples were incubated in duplicate together with two syringes containing only buffered rumen fluid solution to serve as blanks. Cumulative gas volume measurements were read at various time intervals (up to 48 h) of incubation. After each reading, the content in the syringe was shaken properly to ensure proper mixing of the substrate. Cumulative gas production data were fitted to the monophasic logistic model described by Groot et al., (1996):
G =a/(1+(b/t)c)
where :
G= the cumulative volume of gas produced (ml/200 mg DM) at time t (h), a = the asymptotic gas volume from the fermentable fraction (ml/200 mg DM), b=T1/2= time at which half of ‘ a ‘ is reached, and c = parameter determining the shape of the curve. These parameters allowed the calculation of the maximum rate of gas production (Rmax, ml/h) and time at which this rate was reached (Tmax, h) as follows (Bauer et al. 2001):
Rmax = {a × bc) × c × [Tmax (−c−1) ]}/{1 + (bc) × [Tmax (−c) ]}2
Tmax = b × {[(c - 1)/(c + 1)] (1/c)}
2.2.4. Organic matter digestibility and energetic values prediction
Chemical composition data and cumulative gas production after 24 h incubation were used to calculate metabolisable energy (ME) and net energy for lactation (NFL) using equations of Menke and Steingass (1987) for concentrates, grains and by products as reported by Ismail et al. (2005) and of Atwater as reported in FAO (2003). The equations are:
ME (MJ/kg DM)=0.157*GP+0.0084*CP+0.022*EE-0.0081*CA+1.06 (Menke and Steingass 1987)
NEL (MJ/kg DM)= 0.115*GP+0.0054*CP+0.014*EE-0.0054 CA-0.36 (Menke and Steingass 1987)
ME Atwater (KJ/Kg DM) =17CP+37EE+17total carbohydrate; FAO (2003)
ME ATWATER specific (KJ/Kg DM) =14.5CP+35EE+17total carbohydrate; FAO (2003)
Where ME= metabolizable energy, NEL= net energy for lactation, DOM= digestibility of organic matter, G24h = cumulative gas production (ml/200 mg DM), CP=crude protein, EE=ether extract, crude ash (% DM) and digestibility organic matter, respectively.
2.3. Statistical Analysis
Results were subjected to statistical analysis using Student’s t test. Data are presented as mean. Values of P<0.05 were considered statistically significant.
3. Results and discussion
3.1. Proximate composition
The two FS genotypes had almost identical proximate composition as summarized in table 1. Both genotypes were rich in organic matter which was in agreement with reported values by Hooda and Jood (2003), Abo El-Nor et al. (2007) and Kochhar et al. (2006). Ether extract contents were low accounting for less than 5% of dry matter. Such values were lower than most reported ones which ranged from 5 % dry matter (Alamer and Basiouni 2005) to 15.2 % dry matter (Ozan et al. 2011 ). The crude proteins accounted for about one fourth of the dry matter and were mostly made of proteins. Most reported crude proteins contents ranged from 22.01% dry matter (Abo El-Nor et al. 2007) to 31.6% dry matter (Acharya et al. 2006). In the later study, while seeds of four lines selected for their ability to produce high forage had crude proteins contents varying from 28.7 to 31.6 % dry matter, seeds of Indian genotype had crude proteins content of 26% dry matter. The authors attributed the higher crude proteins contents in the four lines not to their genotypic potential but to the difference in nutrient status of the soil where the seeds were grown. Both FS genotypes had the same ADF and NDF contents even though NDF content was slightly higher in the sweet SF genotype.NDF contents were in agreement with those reported by Mullaicharam et al. (2013) for whole (28%) or defatted (32.5%) fenugreek seed, respectively. The sweet genotype had less (P<0.05) starch content than the bitter one, yet both values were very low not exceeding 3% of the seeds dry matter. Fenugreek seed starch contents as high as 20.86 % and as low as 0.32% have been reported by Kochhar et al. (2006) and Nahar et al. (1993), respectively. Although, amino acids profile was not addressed in this study, it is unlikely that the two genotypes had different amino acids make up. Fenugreek seeds contain proteins rich in tryptophan and lysine, and in addition, free amino acids, namely 4-hydroxyisoleucine, arginine, lysine and histidine (Helambe and Dande 2012). Thus, fenugreek seed has been used as food along with meals (Mathur and Choudhry, 2009) and as a supplement to wheat and maize flour for bread making (Al-Habori and Raman 1998) and biscuits (Ibrahium and Hegazy, 2009). Fenugreek seed was also reported to improve the productive performance of hens (Abaza, 2007, Abdalla et al, 2011).
|
Table 1. Proximate composition (%DM) of fenugreek seeds |
|||||||||
|
Fenugreek seed genotypes |
OM |
EE |
ADF |
NDF |
CP |
Proteins |
Starch |
Total carbohydrate |
Non-fibrous carbohydrate |
|
Bitter |
97.00
|
4.80
|
12.2
|
30.6
|
25.6
|
22.83
|
2.63a |
66.6
|
36.04 |
|
Sweet |
96.7
|
4.21
|
11.93
|
33.33 |
25.73
|
22.22
|
1.69b |
66.75
|
33.41 |
|
DM= dry matter; OM=organic matter; EE=ether extract; ADF=acid detergent fiber; NDF=neutral detergent fiber; CP=crude proteins; abmeans in the same column with different letters are different (P<0.05) |
|||||||||
3.2. Biological activities
Secondary metabolites are known to exert beneficial as well as adverse effects, depending on their chemical nature and concentrations in feeds and on the animal species. In the current study, measured fenugreek seed biological properties were limited to the in vitro nitrogen digestibility and gas production as these properties may reflect differences in the two genotypes secondary metabolites interactions unrevealed by chemical methods
3.2.1. In vitro nitrogen digestibility
Table 2 shows the In vitro nitrogen digestibility coefficients of the two fenugreek seed genotypes incubated with or without additional PEG. Digestibility coefficients were not different (P> 0.05) between the two seed genotypes and were not affected (P>0.05) by PEG addition.
|
Table 2. In vitro nitrogen digestibility coefficients (%) of sweet and bitter fenugreek genotypes measured in the presence or absence of polyethylene glycol (PEG) |
||
|
Fenugreek seed genotypes |
No PEG |
With PEG |
|
Bitter |
86.34 |
86.72 |
|
Sweet |
87.48 |
86.76 |
Digestibility coefficients in the present study were much higher than those reported by Hooda and jooda (2003) for raw, soaked and germinated fenugreek seeds which varied from 58.50 to 65.60%. They reported that digestibility, assessed by employing pepsin and pancreatin, was increased after 48 h germination due to reduction in phytic acid and polyphenols contents. Phytic acid can interact with proteins and the phytate-protein complexes become less soluble (Cheryan 1980). Fenugreek phenolics may reduce both dietary protein availability and digestive enzyme activity (Singh et al. 1994). Thus, high levels of these compounds within the seed could compromise the efficiency of fenugreek utilization by non ruminants. In contrast, phytic acid in fenugreek seed can be degraded by rumen microflora and, therefore, of no negative consequence for ruminants and in vitro protein digestibility when assessed using rumen fluid. With regard to fenugreek seed phenolics, the lack of PEG effect observed in the present study suggested that the microbial population in the inoculum was not negatively affected. If tannins had a negative effect, the digestibility coefficients would have been higher in presence of PEG. However, both fenugreek seed genotypes had been found to contain low tannins levels (2.03 to 2.59 mg/g) and mostly of hydrolysable form (Abdouli et al. 2014). Such tannins levels were far below the threshold level (50 mg/g dry matter) in tropical tannin rich plants considered to have anti-nutritional effects for ruminants (Muller-Harvey, 2006). It was, however, close to that (3.8 mg /g) in fenugreek seed reported by Naseri et al. (2013) who incubated fenugreek seed alone or mixed with alfalfa hay at up to 20% of dry matter for up to 48 h and found that after 24 h of incubation, crude protein digestibility coefficient was 63.48; 50.91 or 34.44% for fenugreek seed, alfalfa hay or the 80-20% alfalfa hay-fenugreek seed mixture, respectively.
3.2.2. Gas production
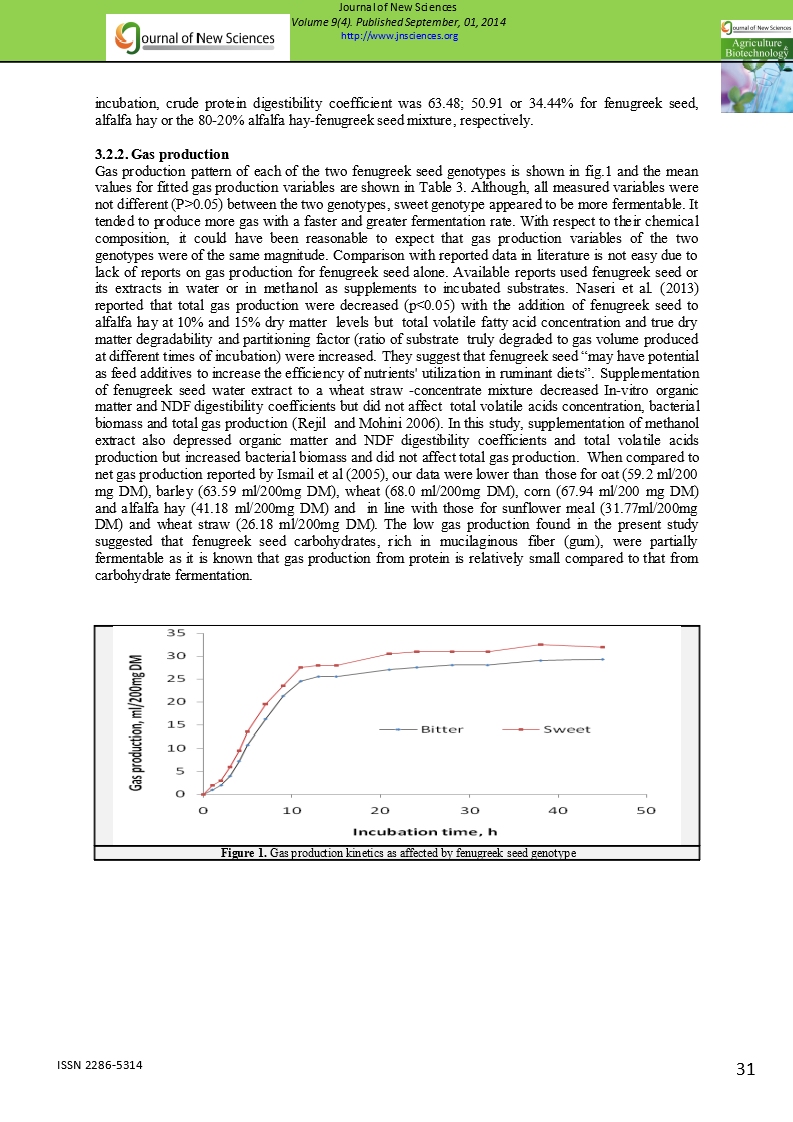
Gas production pattern of each of the two fenugreek seed genotypes is shown in fig.1 and the mean values for fitted gas production variables are shown in Table 3. Although, all measured variables were not different (P>0.05) between the two genotypes, sweet genotype appeared to be more fermentable. It tended to produce more gas with a faster and greater fermentation rate. With respect to their chemical composition, it could have been reasonable to expect that gas production variables of the two genotypes were of the same magnitude. Comparison with reported data in literature is not easy due to lack of reports on gas production for fenugreek seed alone. Available reports used fenugreek seed or its extracts in water or in methanol as supplements to incubated substrates. Naseri et al. (2013) reported that total gas production were decreased (p<0.05) with the addition of fenugreek seed to alfalfa hay at 10% and 15% dry matter levels but total volatile fatty acid concentration and true dry matter degradability and partitioning factor (ratio of substrate truly degraded to gas volume produced at different times of incubation) were increased. They suggest that fenugreek seed “may have potential as feed additives to increase the efficiency of nutrients' utilization in ruminant diets”. Supplementation of fenugreek seed water extract to a wheat straw -concentrate mixture decreased In-vitro organic matter and NDF digestibility coefficients but did not affect total volatile acids concentration, bacterial biomass and total gas production (Rejil and Mohini 2006). In this study, supplementation of methanol extract also depressed organic matter and NDF digestibility coefficients and total volatile acids production but increased bacterial biomass and did not affect total gas production. When compared to net gas production reported by Ismail et al (2005), our data were lower than those for oat (59.2 ml/200 mg DM), barley (63.59 ml/200mg DM), wheat (68.0 ml/200mg DM), corn (67.94 ml/200 mg DM) and alfalfa hay (41.18 ml/200mg DM) and in line with those for sunflower meal (31.77ml/200mg DM) and wheat straw (26.18 ml/200mg DM). The low gas production found in the present study suggested that fenugreek seed carbohydrates, rich in mucilaginous fiber (gum), were partially fermentable as it is known that gas production from protein is relatively small compared to that from carbohydrate fermentation.
|
|
|
Figure 1. Gas production kinetics as affected by fenugreek seed genotype |

|
Table 3. In vitro gas production volume and estimated parameters of the two fenugreek seed genotypes |
|||||
|
Fenugreek seed genotypes |
G24 h, ml/200 mg DM |
Potential gas production, ml/200mg DM |
T ½ , h |
Tmax , h |
Rmax , ml/h |
|
Bitter |
27.5 |
28.79 |
6.11 |
4.40 |
3.52 |
|
Sweet |
31.00 |
32.21 |
5.74 |
3.76 |
3.87 |
|
G24h =24 h cumulative gas production; T1/2= time at which half of potential gas production is reached; Rmax= maximum rate of gas production; T max= time at which this rate was reached. |
|||||
3.3. Energetic value
In view of the foregoing comparison of the proximate compositions and in vitro nitrogen digestibility coefficients of the two fenugreek seed genotypes, it appeared that both genotypes had the same nutritive value as source of energy and proteins.
Regarding the energetic aspect for nonruminants, metabolizable energy values calculated from chemical composition data using Atwater general or specific factor systems were found to be similar for both genotypes (Table 4). The general system uses a single factor for protein, fat, and carbohydrate regardless of the food in which they are found and the same energy value for protein and carbohydrate (17 KJ/ g). In the specific system, specific factors are set per group of foods. In the present study, metabolizable energy values of fenugreek seeds were calculated using factors set for legumes and nuts (mature dry beans, peas, nuts and soybeans). Calculated energetic values for both genotypes were close to that reported by Kochhar et al. (2006) for bitter fenugreek seed. Metabolizable energy values might have been overestimated since total carbohydrates were attributed 17 KJ/g whereas fenugreek seed total carbohydrates are rich in gum and cellulose which have been reported to have energy values of only 14.7 and 1.7 KJ/g, respectively (Harley et al. 1989).
As an energy source for ruminants, calculated metabolizable energy and net energy for lactation values based on in vitro gas production and chemical composition were slightly but significantly (P<0.0001) higher for the sweet fenugreek seed genotype (Table 4). These differences between both genotypes appeared to be related to the difference in the volumes of gas produced after 24 h fermentation which tended to be higher for the sweet fenugreek seed genotype (Table 3). These values were much lower than those reported by Ismail et al (2005) for oat, barley, wheat, corn, wheat bran, alfalfa hay and vetch hay. The low energetic values found in the present study were a reflection of the low gas volumes produced after 24 h fermentation as these are affected by the highest coefficients in the prediction equations.
|
Table 4. Calculated energetic values of the two fenugreek seed genotypes |
||||
|
Fenugreek seed genotypes |
ME βAtwater , KJ/Kg DM |
ME γ Atwater specific , KJ/Kg DM |
ME£ , MJ/Kg DM |
NEL¥ , MJ/Kg DM |
|
Bitter |
1745.06 |
1666.34 |
5.67a |
2.99 a |
|
Sweet |
1728.02 |
1650.15 |
6.21b |
3.39b |
|
£ME (MJ/kg DM): 0.157G24h+0.0084CP+0.022EE-0.0081Ash+1.06 (Menke and Steingass 1987); ¥NEL (MJ/kg DM): 0.115G24h+0.0054CP+0.014EE-0.0054 Ash-0.36 (Menke and Steingass 1987); βME Atwater (KJ/Kg DM) =17CP+37EE+17total carbohydrate; FAO (2003) γ ME Atwater specific (KJ/Kg DM) =14.5CP+35EE+17total carbohydrate; FAO (2003) abmeans in the same column with different letters are different (P<0.0001) |
||||
4. Conclusion
The recently selected sweet fenugreek seed genotype and the common better one did not differ significantly with respect to chemical composition and in vitro nitrogen digestibility and gas production. Such results indicated that both fenugreek seed genotypes can be used as valuable source of proteins feedstuffs in ruminant’s nutrition. In vivo comparison may be useful in further evaluation of the two genotypes.
5.References
Abaza IM (2007) Effect of using fenugreek, chamomile and radish as feed additives on productive performance and digestibility coefficients of laying hens. Egypt Poult Sci 27, 199-218.
Abdalla AA, Mona, Ahmed M, Abaza IM, Aly OM, Hassan EY (2011) Effect of using some medicinal plants and their mixtures on productive and reproductive performance of gimmizah strain 2- egg production period. Egypt Poult Sci 31, 641-654.
Abdouli H, Missaoui H, Jellali S, Tibaoui G, Tayachi L (2014) Comparison of two fenugreek seed genotypes: bitterness value, secondary metabolites contents and biological activities. J New Sci 7(3):19-27.
Abo EI-Nnor SAH , Khattab HM , Al-Alamy HA, Salem FA, Abdou MM (2007) Effect of Some Medicinal Plants Seeds in the Rations on the Productive Performance of Lactating Buffaloes. International. J Dairy Sci 2(4), 348-355.
Acharya SN, Srichamroen A, Basu SK, Ooraikul B, Basu T (2006) Improvement in the nutraceutical properties of fenugreek (Trigonella foenum-graecum L.). Songklanakarin J Sci and Technol 28:1-9.
Alamer M, Basiouni G (2005) Feeding effects of fenugreek seeds (Trigonella foenum-graecum L.) on lactation performance, some plasma constituents and growth hormone level in goats. Pak J Biol Sci 25:28-46.
Al-Habori M, Raman A (1998) Antidiabetic and hypocholesterolemic effects of fenugreek. Phytother Res 12:233-242.
AOAC (1984) Official methods of analysis.10th Edition, Washington DC, USA.
Bauer E, Williams BA, Voigt C,Mosenthin R, and Verstegen Martin WA (2001) Microbial activities of feces from unweaned and adult pigs, in relation to selected fermentable carbohydrates. Anim Sc 73:313–322.
Bradford MM (1976) A rapid and sensitive for the quantitation of microgram quantitites of protein utilizing the principle of protein-dye binding. Analyt Biochem 72:248-254.
Cheryan M (1980) Phytic acid interaction in food systems. Crit Rev Food Sci Nutr 13(4): 297-335.
FAO (2003) Food energy – methods of analysis and conversion factors. Food and nutrition paper 77, Rome, pp87
Groot JCJ, Cone JW, Williams BA, Debersaques FMA, Lantinga EA (1996) Multiphasic analysis of gas production kinetics for in vitro fermentation of ruminant feeds. Anim Feed Sci and Technol 64(1):77‐89.
Harley LJ, Davies IR, Livesey G (1989) Digestible energy value of gums in the rat—data on gum Arabic. Food Additives & Contaminants 6(1):13-20
Helambe SS, Payal DR (2012) Fenugreek (Trigonella foenum-graecum L.): An Overview. InterJ Current PharmacReview and Res 2(4):169-187.
Hooda S, Jood S (2003) Effect of soking and germination on nutrient and antinutrient contents of (Trigonella foenum graecum L.). J Food Biochem 27:165-176.
Ibrahium MI and Hegazy AI (2009) Iron Bioavailability of Wheat Biscuit Supplemented by Fenugreek Seed Flour. World Journal of Agricultural Sciences 5 (6):769-776.
Ismail A, Haydar O, Can K H, Recep K (20045) Determination of the Metabolizable Energy (ME) and Net Energy Lactation (NEL) Contents of Some Feeds in the Marmara Region by In vitro Gas Technique. Turk J Vet Anim Sci 29 :751-757
Jarvis CE, Walker JRL (1993) Simultaneous, rapid, spectrophotometric determination of total starch, amylase and amylopectin. J Sci Food Agri 63:53-57.
Kochhar A, Nagi M, Sachdeva R (2006) Proximate Composition, Available Carbohydrates, Dietary Fibre and Anti Nutritional Factors of Selected Traditional Medicinal Plants. J Hum Ecol 19(3):195-199.
Mathur P, Choudhry M (2009) Consumption pattern of fenugreek seeds in Rajasthani families. J Hum Ecol 25(1):9-12.
Menke, K. and H. Steingass (1988) Estimation of the energetic feed value obtained from chemical analysis and in vitro gas production using rumen fluid. Anim. Res. Dev 28:7-55.
Menke KH, Steingass H (1987) Sch.tzung des energetischen Futterwerts aus der in vitro mit Pansensaft bestimmten Gasbildung und der chemischen Analyse. II. Regressionsgleichungen. .bers. Tierern.hrg 15:59-94.
Mullaicharam AR, Deori G, Uma Maheswari R (2013) Medicinal Values of Fenugreek -A Review. Res J Pharmac, Biolo and Chem Sci 4(1):1304-1313.
Muller-Harvey I (2006) Unravelling the conundrum of tannins in animal nutrition and health. J Anim Sci Food Agri 86:2010-2037.
Nahar N, Mosihuzzaman M, Dey SK (1993) Anaylsis of free and sugar dietary fibre of some vegetables of Bangladesh. Food Chem 46(4):397-400.
Naseri V, Hozhabri F, Kafilzadeh F (2013) Assessment of in vitro digestibility and fermentation parameters of alfalfa hay-based diet following direct incorporation of fenugreek seed (Trigonella foenum) and asparagus root (Asparagus officinalis). J Anim Physiol Anim Nutr (Berl). 97(4):773-84.
NRC (2001) Nutrient Requirements of Dairy Cattle. (7th Rev. Ed.) National research council, National Academy Press. Washington, DC
Ozan NC, Roman P, Magdalena R, Surya A (2011) Characterization of Fenugreek (Trigonella foenum-graecum) Seed Lipids. J Amer Oil Chem Soci 88:1603–1610.
Rejil M C, Mohini M (2006) Effect of fenugreek seed extracts on in-vitro digestibility of feed. Indian J Anim Nutrit 23(4):202-205
Shashi Kala (1997) Management of non insulin dependent diabetes mellitus by using traditional medicinal plant products. Ph.D. Thesis. Haryana Agricultural University, Hisar, India
Sharma RD (1986) Effects of fenugrek seeds and leaves on blood glucose and serum insulin response in human subjects. Nutr Res 6:1353-1363.
Singh J, Gupta K, Arora SK (1994) Changes in antinutritional factors of developing seeds and pod wall of fenugreek (Trigonella foenum graceum L). Plant Food for Human Nutrit 46:77-84.
Tilley JMA, Terry RA (1963) A two- stage technique for the In Vitro digestion of forage crops. Grass and Forage Sci18:104–111.
Udayasekhera P, Sharma RD (1987) An evaluation of protein quality of fenugreek seeds and their supplementary effect. Food Chem 24:1-5
Van Soest PJ, Robertson JB, Lewis BA (1991) Methods of dietary fiber, neutral detergent fiber and non-starch carbohydrates in relation to animal nutrition. J Dairy Sci 74:3583-359