- Category: Volume 42
- Hits: 7298
Multiple-Trait estimation of genetic parameters of yield traits of dairy cattle in Tunisia using an animal Model
| [Volume 42, Article 6] | 807 kB |
H. BEN ZAABZA1*
A. BEN GARA2
B. JEMMALI2
M. A. FERCHICHI1
B. REKIK2
1 Institut National Agronomique 43, Avenue Charles Nicoles 1082-Tunis-Mahrajène Tunisie
2 Département des productions animales, Ecole supérieure d’Agriculture de Mateur, 7030, Mateur, Tunisie.
Abstract – A Markov Chain Monte Carlo Bayesian analysis was used on Tunisian dairy cattle data. Data included 14069 lactation records collected from 7139 animals over 16 freshening years from 1997 to 2013. The used model included fixed effects (herd-year, month of calving, and age-parity), a permanent effect, additive genetic effect, and a residual effect. (Co)-variance components were estimated by Bayesian methods. Gibbs Sampling was used to obtain conditional posterior distributions for additive, permanent environmental and residual variances and other genetic parameters. The variance of the residual effects represents the highest average between the three variance components, which is in the vicinity of 1493600 25031, 1833.4 29.391, and 1368.2 22.074, for milk, fat, and protein yields, respectively. Posterior means of heritability were 0.153 0.018, 0.11 0.014, and 0.13 0.016 for the same traits, respectively. Posterior means of repeatability were in the range of 0.342 0.011, 0.252 0.011, and 0.31 0.01 for milk, fat, and protein yields, respectively. The largest genetic correlation (0.94) was observed between milk and protein yields
 . These results should be useful to implement genetic evaluation for the Tunisian Holstein population. However, results also indicate that there should be additional focus on data recording quality.
Keywords: Markov Chain Monte Carlo, Bayesian Method, Gibbs Sampling, Posterior means, Genetic parameters
- Introduction
Genetic selection in livestock populations and especially in dairy cattle programs is traditionally based on phenotypic records of the individual and its relatives (Meuwissen et al., 2001). Henderson’s method 3 (Henderson, 1953) for estimating variance components was widely used until the late 1970’s. With rapid advances in software technology, likelihood based methods gained favor in animal breeding. BLUP can be derived only if the dispersion parameters (variance and covariance components) are known (Sorensen and Gianola, 2002). In recent years, Bayesian methods have been developed for variance component estimation in animal breeding (Gianola and Fernando, 1986; Sorenson et al., 1994; Hallander et al., 2010). Bayesian analysis is gaining popularity because of its more comprehensive assumptions than those of classical approaches and its flexibility in resolving a wide range of biological problems (Waldmann, 2009; Hallander et al., 2010). In the Bayesian approach, the idea is to combine what is known about the statistical ensemble before the data are observed (prior probability distributions) with the information coming from the data, to obtain a posterior distribution from which inferences are made using the standard probability calculus techniques ( Sorensen and Gianola, 2002; Robert, 2006). The size of the Holstein cow population has substantially increased over the recent years in Tunisia through the importation of pregnant heifer and semen (Ben Zaabza et al., 2016a). Hammami et al. (2008) reported that 60% of all inseminations of cows in Tunisia used Holstein semen. In Tunisia, breeding decisions are based on recorded yield or an intra-herd index for cows, and essentially on a milk yield index for AI bulls. However, breeding decisions do not take into account traits other than milk yield. There are four types of herds, the state herds, the cooperative herds, the groups of investors’ herds, and the farmers’ herds. These herds differ with feeding and management models and milk production levels (Rekik and Ben Gara., 2004; Ben Gara et al., 2006). Estimation of dispersion parameters in multiple-trait is more challenging than in univariate mixed models because of the greater dimensions of multiple-trait genetic evaluation systems. The estimation of genetic parameters is an important step in genetic evaluation because they provide an indication of the capacity of a population to respond to selection, and thus, the potential of that population to evolve (Thomson and Hill, 2000a; Thomas et al., 2000b). The purpose of this study was to estimate genetic parameters of fat, protein, and milk yields in a multiple trait animal model using Bayesian analysis approach.
- Materials and methods
- Data
Data were provided by the National Centre for Genetic Improvement at Sidi Thabet, Tunis. Data consisted of 25765 completed lactation records collected from 1997 through 2013 on 9261 Holstein cows in 11 herds. All records included 305-d milk, fat, and protein yields. Each record included the international identification number, herd code, lactation number, calving date, milk yield, fat and protein percentages. The pedigree file included the sire, the dam, the date of birth, and the herd of origin for each animal. After editing for missing identification number, and unreasonable production levels for daily milk yield (<1.0 and > 50 kg), fat content (< 1.5% and > 5% and protein percentage (< 1% and >5%), 14069 records remained on 7193 cows sired by 326 bulls. Description of data structure is shown in table 1.
|
Table 1. Data structure
|
|||||
|
Number |
Mean 305-d yield(kg) |
Cows in 1stparity % |
|||
|
Herd |
Cows |
Milk |
Fat |
Protein |
|
|
1 |
286 |
6010.54 |
210.477 |
188.71 |
31.88 |
|
2 |
359 |
6348.88 |
203.73 |
192.092 |
33.15 |
|
3 |
360 |
5641.61 |
184.93 |
176.63 |
37.66 |
|
4 |
361 |
5668.95 |
189.103 |
172.103 |
41.49 |
|
5 |
396 |
6491.14 |
220.23 |
194.30 |
29.01 |
|
6 |
636 |
6929.83 |
229.24 |
216.21 |
36.77 |
|
7 |
762 |
6583.44 |
226.293 |
213.306 |
43.81 |
|
8 |
876 |
6851.03 |
266.52 |
236.89 |
35.40 |
|
9 |
1016 |
6460.84 |
279.65 |
264.201 |
42.65 |
|
10 |
1063 |
6018.22 |
214.53 |
194.16 |
39.6 |
|
11 |
1078 |
6414.83 |
272.64 |
260.35 |
44.5 |
|
Average |
653.9 |
6310.846 |
227.031 |
209.904 |
37.81
|
- Statistical Model
The used mixed linear model for 3 traits y, z, and t in matrix notation was as follows:
 =
= 
 +
+ 
 +
+ 
 +
+  , (1)
, (1)
where  ,
,  and
and  are vectors of fixed effects affecting traits y, z, and t.
  ,
,  and
and  are vector of permanent effects order (s), and
  ,
,  and
and  are vectors of order q of additive genetic values for traits y, z, and t, and
  (
( ) is a vector of residual effects of order n(n) for the same traits y, z, and t. Fixed effects included herd-year, month of freshening, and age-parity. Matrices X, W, and Z, with subscripts y, z, and t are known incidence arrays relating location effects for each trait to data.
Put now  =
=  , P=
, P=  , a=
, a=  with appropriate partitions for matrices X, W, and Z, such that X= , W= , Z= ,
The conditional distribution of the complete data for each individual, given the parameters, is assumed to be multivariate normal and can be written as
Q|
 MVN(X
MVN(X
where  contains y, z, and t. We shall assume that records have been sorted by individual, so that Q is a sequence of y, z, and t for each individual. Hence, the sorting is such that the residual variance–covariance matrix can be written
  a block diagonal matrix with n sub-matrices of residual co-variances
  , where
  =
= 
And,  is the residual variance for trait y,
  is the residual variance for trait z, and
  is the residual covariance.
-
Distribution a priori
Prior distributions are needed in Bayesian modeling. For the vector β, a proper uniform distribution is assigned, with density
P constant
The vector of additive genetic values is assumed to follow, a priori, the multivariate normal distribution.
 |
| 
 ,
,
where  is the additive genetic relationship matrix of order q×q, conditionally on an unknown genetic covariance matrix
  of order k
 k and
k and  represents Kronecker product.
= 
 is the variance between additive genetic effects affecting trait 1, and
  is the additive covariance between traits. Similarly, the prior distribution of P is also multivariate normal.
 |
| MVN
MVN , where
  =
= 
The prior distributions of covariance matrices  are each k-dimensional inverse Wishart. Three-dimensional scaled inverted Wishart distributions were assigned as prior processes for each of the
  co-variance matrices, with the respective densities being.
P( | )
)  exp(
exp( ,
,
P( | )
)  exp(
exp( ,
,
P( |
| )
)  exp(
exp( ,
,
where k = 3. In these expressions, and Vi (i=e, p, a) are hyperparameters of the distributions, which are assumed known. The marginal distribution for each parameter is found via integration of multivariate density functions using a Gibbs sampling technique as developed by Sorensen and Gianola (2002).
- Gibbs Sampling
In a standard multiple-trait analysis, all full conditional distributions needed for Bayesian implementation of a MCMC algorithm, such as the Gibbs sampler (García-Cortés and Sorensen, 1996; Waldmann et al., 2009). Variance components were estimated with a Bayesian approach via the Gibbs sampling algorithm as implemented by Misztal et al. (2002). Posterior means of variance components, heritability, and correlation estimates were obtained using 50,000 samples. After a burn-in of 5000 samples, and then one out of 10 iterations was kept for subsequent analysis Thus, a total of 4500 samples were saved. Convergence of Gibbs chains was monitored by inspection of plots related to selected parameters.
- Results and Discussion
Summary statistics of distributions, the mean, median, and variance and correlations among production traits are reported in table 2-5. The estimated marginal posterior densities of heritability estimates are shown in figure1. Typically, posterior densities of genetic parameters were not symmetric, and associated with a reasonable difference between mean, mode, and median. Genetic and permanent environment correlations between milk, fat, and protein yields were close to 1.00. Genetic correlations between milk and fat, milk and protein, and fat and protein yields were 0.81, 0.94, and 0.86, respectively. Permanent environment correlations between yield traits were larger than the corresponding genetic correlations, except for protein with fat yields. Heritability estimates from this analysis were 0.15, 0.11, and 0.13 for milk, fat, and protein yields, respectively, with standard errors of approximately 0.01. Posterior means of repeatability (Tables 3 and 4) were similar for milk and protein yields (0.3), but repeatability for fat yield tended to be slightly lower than those for milk yield (0.25). The additive variance of the milk yield ranged from 204000 kg2 to 492000 kg2. However, the additive variance of the fat yield ranged from 228 kg2 to 300 kg2. Permanent environmental variances were larger than additive genetic variance for milk, fat, and protein yields, indicating that environmental effects had a higher impact on the variation of milk production. For all traits, estimated permanent environmental variances were around 1.3 times higher than the additive genetic variances. The residual variances were high in comparison with genetic additive and permanent environmental variance for 305-d milk, fat, and protein yields. Estimated genetic correlations among 305-d milk, fat, and protein yields were comparable with those estimated by Hammami et al. (2008b), and Muir et al. (2007). However, the genetic correlation between milk and fat yields was larger than those obtained by Carabaño et al. (1989) on United States data. Estimates of the genetic correlations between milk and protein yields were also somewhat greater than the estimate (0.88) reported by Van Vleck and Dong (1998). Estimates of heritability for milk ranged from 0.13 to 0.21, these results are similar to those observed from study used a 305-d model as applied in this study (Ben Gara et al., 2006; Ben Zaabza et al., 2016a). Values obtained in this study for heritability of fat-yields are similar in magnitude and trend to those observed by Carabaño et al. (1989). However, heritability of Milk, fat, and protein yields were smaller than those found in the literature (Ahlborn and Dempfle, 1992; De Ross et al., 2004; Muir et al., 2007). Considerable variation exists between countries for genetic parameters estimates related to herd management systems (De Veer and Van Vleck, 1987; Zwald et al., 2001; Ojango et al., 2002). Smaller genetic variances and heritability for Tunisian dairy cattle population than for the other Holstein populations can be explained by the lowest production levels and stressful climatic conditions (Veerkamp et al., 1998; Ojango et al., 2002; Muasya et al., 2014). In fat, In Tunisia, the climate varies from arid in the South to humid in the North, and characterized by hot summers coupled with high humidity (Ben Zaabza et al., 2016b). In Tunisia, the feeding system is unbalanced and rations are based mainly on concentrates. The forage is characterized by poor quality, and high rate in indigestible cellulosic constituents that could be possible causes of the lower milk yield. All these factors could lead to decreases in production performances and increase in the incidence of health troubles such as acidosis at the herd level. Increased heat stress can severely depress milk production (Huquet et al., 2012; Hammami et al., 2015). Posterior mean estimates of additive genetic variance of 305-d milk yields is 2 times lower than that obtained by Misztal et al. (1992) and Carabaňo et al.(1989) analyzing 305 d milk yield on US Holsteins. However, additive genetic estimates in our study were larger than those estimated by Ojango et al. (2002) in the Kenyan data (349350 kg2 vs. 221797). Ojango et al. (2002) estimated genetic parameters for 305-d milk yield using bivariate animal model analysis in the Kenya and UK. They reported a difference in genetic variance between two countries (221797 kg2 in Kenya vs. 582537 in UK). Posterior means of repeatability (Tables 3 and 4) were similar for milk and protein yields (0.3), but repeatability for fat yield tended to be slightly lower than those for milk yield (0.25). For milk yield, a similar pattern was observed by Ben Gara et al. (2006) in the same population using earlier records. Moreover, the additive variance of the fat yield ranged from 228 kg2 to 300 kg2. Estimates obtained by Campos et al. (1994) were 366.634 kg2 for milk yield and 516 kg2 for fat yield of Holstein cattle in Florida using derivative-free REML with the animal model. The difference between estimates in this study and those of literature may be partially due to inaccurate pedigree information on imported semen of some sires (Hammami et al., 2008b), and the lowest average number of daughters per bull. Estimates of residual variance for milk, fat, and protein yields were 1493600, 1833.4, and 1368.2 kg2, respectively. These estimates were larger than those estimated by Sun et al. (2009) using a multiple-trait model including female fertility and milk production traits. They reported residual variance estimates of 955216, 1504.3, and 841.6 kg2 for milk, fat, and protein yield, respectively. Uncontrolled environmental factors might be a possible explanation for this observed trend. However, observed values for residual variance were lower than those obtained in the previous study on a sample of the Iranian Holstein dairy cattle using Bayesian procedure (Alijani et al., 2012). Component of the residual variance could include the whole of the factors not yet taken into account, which they are of genetic origin (nonadditive genetic effects) or related to the environment (factor not identified such as the reproductive state of the animal). THomas and Hill (2000) reported that missing pedigree information and incorrectly assigned relationships can cause larger bias in estimates of genetic parameters and variance components.
|
|
|
|
|
|
|
|
|
|
|
|
|
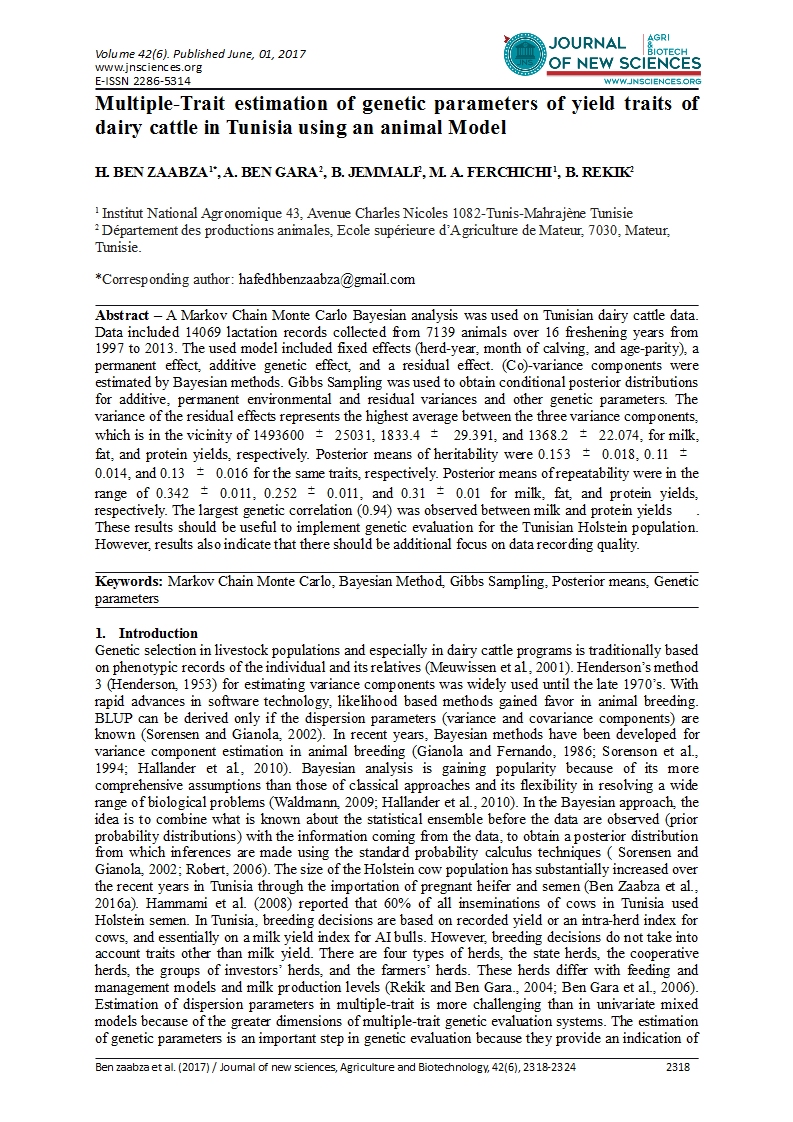
Figure 1. Estimated marginal posterior densities of heritability (h2), and repeatability (r) of milk, fat, and protein yields.
|
|


|
Table 2. Genetic (above diagonal) and permanent environmental (below diagonal) correlations (SD in brackets) for 305-d milk, fat and protein yields.
|
|||
|
Trait |
Milk yield 305-d |
Fat yield 305-d |
Protein yield 305-d |
|
Milk yield 305-d |
|
0.81(0.01) |
0.94(0.01) |
|
Fat yield 305-d |
0.82(0.01) |
|
0.86(0.01) |
|
Protein yield 305-d |
0.95(0.02) |
0.85(0.03)
|
|
|
Table 3. Summary of the marginal distributions of additive genetic, permanent environment (PE) and residual (co)variance components, heritability, repeatability associated to 305-d milk yields
|
||||||
|
Parameter |
Mean |
SD |
Min |
Max |
Median |
Mode |
|
Additive genetic variance |
349350 |
42681 |
26590 |
430100 |
348200 |
328920 |
|
PE variance |
427450 |
40053 |
348400 |
503800 |
428100 |
419140 |
|
Residual variance |
1493600 |
25031 |
144800 |
1546000 |
1493000 |
1501300 |
|
Heritability |
0.153 |
0.018 |
0.093 |
0.21 |
0.153 |
0.127 |
|
Repeatability |
0.342 |
0.011 |
0.097 |
0.377 |
0.342 |
0.333
|
|
Table 4. Summary of the marginal distributions of additive genetic, permanent environment (PE) and residual (co)variance components, heritability, repeatability associated to 305-d fat yields.
|
||||||
|
Parameter |
Mean |
SD |
Min |
Max |
Median |
Mode |
|
Additive genetic variance |
268.79 |
37.00 |
204.90 |
342.50 |
267.20 |
241.89 |
|
PE variance |
349.91 |
36.32 |
281.30 |
422.40 |
350.30 |
346.54 |
|
Residual variance |
1833.4 |
29.39 |
1777.00 |
1891.0 |
1833.00 |
1836.5 |
|
Heritability |
0.11 |
0.014 |
0.086 |
0.184 |
0.109 |
0.109 |
|
Repeatability |
0.252 |
0.011 |
0.267 |
0.349 |
0.252 |
0.235
|
|
Table 5. Summary of the marginal distributions of additive genetic, permanent environment (PE) and residual (co)variance components, heritability, repeatability associated to 305-d protein yields.
|
||||||
|
Parameter |
Mean |
SD |
Min |
Max |
Median |
Mode |
|
Additive genetic variance |
262.67 |
34.40 |
202.90 |
332.9 |
260.90 |
241.26 |
|
PE variance |
352.13 |
33.046 |
289.00 |
416.60 |
353.00 |
356.14 |
|
Residual variance |
1368.20 |
22.074 |
1328.00 |
1414.00 |
1368.00 |
1366.40 |
|
Heritability |
0.132 |
0.016 |
0.086 |
0.184 |
0.131 |
0.109 |
|
Repeatability |
0.31 |
0.01 |
0.267 |
0.342 |
0.31 |
0.319
|
- Conclusion
Genetic parameters of milk, fat, and protein yields were estimated for Tunisian Holsteins using a Multivariate Bayesian analysis. Heritability and repeatability were moderate but similar to previous literature estimates from studies that used a comparable model in the same population, indicating the possibility of a satisfactory response to selection for these production traits in Tunisian Holsteins. Genetic parameters estimates in this study might be used in the official genetic evaluation for production traits for Tunisian Holsteins.
Acknowledgements
The authors wish to acknowledge the Tunisian Livestock and Pasture Office for providing data. Sincere gratitude to Dr H. Hammami for help with numerous computational problems and for invaluable advice on numerous occasions.
- References
Ahlborn G, Dempfle L (1992). Genetic parameters for milk production and body size in New Zealand Holstein-Friesian and Jersey. Livest. Prod. Sci. 31: 205-219.
Alijani S, Jasouri M, Pirany N, Kia HD (2012). Estimation of variance components for some production traits of Iranian Holstein dairy cattle using Bayesian and AI-REML methods. Pak Vet J. 32: 562-566.
Ben Gara A, Rekik B, Bouallègue M (2006). Genetic parameters and evaluation of the Tunisian dairy cattle population for milk yield by Bayesian and BLUP analyses. Livest. Prod. Sci. 100: 142-149.
Ben Zaabza H, Ben Gara A, Hammami H, Ferchichi MA, Rekik B (2016a). Estimation of variance components of milk, fat, and protein yields of Tunisian Holstein dairy cattle using Bayesian and REML methods. Arch. Anim. Breed. 59: 243-248.
Ben Zaabza H, Ben Gara A, Hammami H, Jemmali B, Ferchichi MA, Rekik B (2016b). Genetic parameters of reproductive traits in Tunisian Holsteins. Arch. Anim. Breed. 59: 209-213.
Campos MS, Wilcox, CJ, Becerril CM, Diz, A (1994). Genetic Parameters for Yield and Reproductive Traits of Holstein and Jersey Cattle in Florida. J. Dairy Sci. 77: 867-873.
Carabaño MJ, Van Vleck LD, Wiggans, GR, Alenda, R (1989). Estimation of genetic parameters for milk and fat yields of dairy cattle in Spain and in the United States, J. Dairy Sci. 72: 3013–3022.
De Ross APW., Harbers AGF, De Jong G (2004). Random herd curves in a test-day model for milk, fat, and protein production of dairy cattle in the Netherlands. J. Dairy Sci., 87: 2693-2701.
De Veer JC, Van Vleck LD (1987). Genetic parameters for first lactation milk yields at three levels of herd production. J. Dairy Sci. 70: 1434-1441.
García-Cortés LA, Sorensen D (1996). On a multivariate implementation of the Gibbs sampler. Genet. Sel. Evol. 28: 121-126.
Gianola, D, Fernando RL (1986). Bayesian methods in animal breeding, J Anim. Sci. 63: 217-244.
Hallander, J, Waldmann P, Wang, C, Sillanpaa MJ (2010). Bayesian Inference of Genetic Parameters Based on Conditional Decompositions of Multivariate Normal Distributions. Genetics. 185: 645–654.
Hammami, H, Rekik B, Soyeurt H, Bastin C, Stoll J, Gengler N (2008a). Genotype x Environment Interaction for Milk yield in Holsteins Using Luxembourg and Tunisian Populations. J. Dairy Sci. 91: 3661-3671.
Hammami, H, Rekik B, Soyeurt H, Ben Gara A, Gengler, N. (2008b). Genetic Parameters for Tunisian Holsteins using a test-day Random Regression Model. J. Dairy Sci. 91: 2118-2126.
Hammami, H, Vandenplas J, Vanrobays M. L, Rekik B, Bastin C, Gengler N (2015). Genetic analysis of heat stress effects on yield traits, udder health, and fatty acids of Walloon Holstein cows. J. Dairy Sci. 98: 1-13.
Huquet B, Leclerc H, Ducrocq V (2012). Characterization of French dairy farm environments from herd-test-day profiles. J. Dairy Sci. 95: 4085-4098.
Meuwissen THE, Hayes B. J, Goddard ME (2001). Prediction of total genetic value using genome-wide dense marker maps. Genetics. 157: 1819-1829.
Misztal I, Lawlor TJ, Short TH (1992). MultipleTrait Estimation of Variance Components of Yield and Type Traits Using an Animal Model. J. Dairy Sci. 75: 544-551.
Misztal I, Tsuruta S, Strabel T, Auvray B, Druet T, Lee DH (2002). BLUPF90 and related programs (BGF90). Proc. 7th World Congr. Genet. Appl. Livest. Prod., Montpellier, France.CD-ROM communication., 28:07.
Muasya, T K, Peters K J, Kahi, AK (2014). Effect of diverse sire origins and environmental sensitivity in Holstein-Friesian cattle for milk yield and fertility traits between selection and production environments in Kenya. Livest. Sci. 162: 23-30.
Muir BL, Kistemaker G, Jamrozik J, Canavesi, F (2007). Genetic parameters for a multiple-trait multiple-lactation random regression test-day model in Italian Holsteins. J. Dairy Sci. 90: 1564-1574.
Ojango, JMK., Pollot GE (2002). The relationship between Holstein bull breeding values for milk yield derived in both the UK and Kenya. Livest. Prod. Sci. 74: 1-12.
Rekik B, Ben Gara, A (2004). Factors affecting the occurrence of atypical lactations for Holstein-Friesian cows. Livest. Prod. Sci. 87: 245-250.
Robert C. P (2001). The Bayesian choice. Springer-Verlag, New York, 2nd edition.
Sorensen D, Gianola D (2002). Likelihood, Bayesian, and MCMC Methods in Quantitative Genetics. Springer, New York.
Sorensen DA, Wang CS, Jensen J, Gianola, D (1994). Bayesian analysis of genetic change due to selection using Gibbs sampling. Genet. Sel. Evol. 26: 333-360.
Sun, C, Madsen P, Lund MS., Zhang Y, Nielson US, Su G (2010). Improvement in genetic evaluation of female fertility in dairy cattle using multiple-trait models including milk production traits. J. Anim. Sci. 88: 871-878.
Thomas SC., Hill, WG (2000a). Estimating quantitative genetic parameters using Sibships reconstructed from marker data. Genetics. 155: 1961-1972.
Thomas SC, Pemberton JM, Hill, WG (2000b). Estimating variance components in natural populations using inferred relationships, Heredity. 84: 427-436.
Van Vleck LD, Dong MC (1988). Genetic (co) variances for milk, fat, and protein yield in Holsteins using an animal model. J. Dairy Sci. 71: 3040-3046.
Veerkamp, RF, Goddard, ME (1998). Covariance Functions across herd production levels for test day records on milk, fat, and protein yields. J. Dairy Sci. 81, 1690-1701.
Waldmann, P (2009). Easy and flexible Bayesian inference of quantitative genetic parameters. Evolution. 63: 1640-1643.
Zwald, NR, Weigel KA, Fikse WF, Rekaya, R (2001). Characterization of dairy production systems in countries that participate in the international bull evaluation service. J. Dairy Sci. 84: 2530–2534.
